HTML and RMap Export
The updated AOR viewer has the possibility to export research findings in two formats: as a HTML file and as a RMap linked data graph. This page contains information on how to use these export functions and what can be done with the exported files. First of all, in order to export research findings, click on the “Export current research” button in the top bar of the viewer:

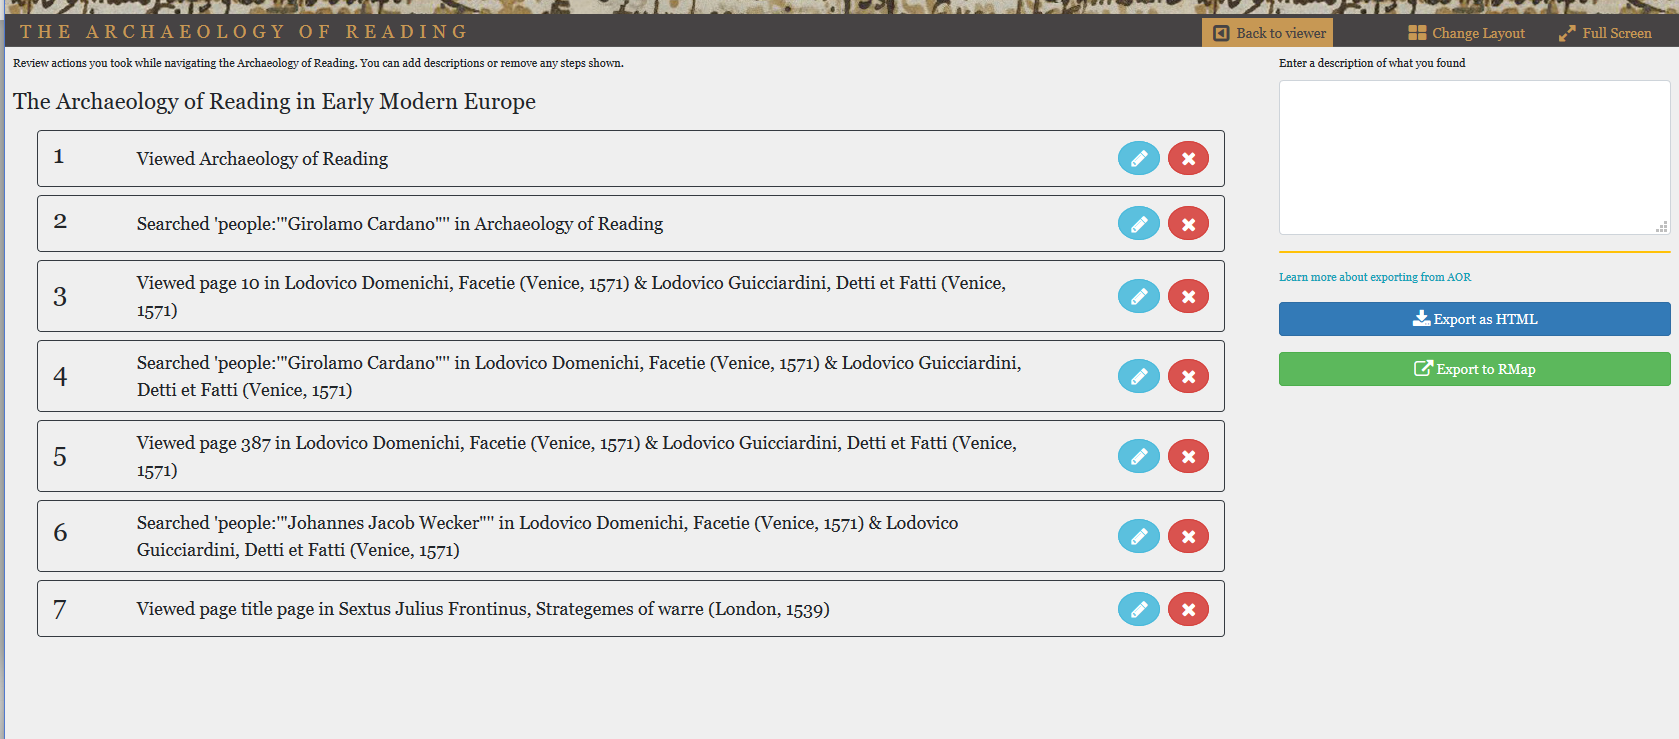
The export current research screen in the AOR viewer contains an overview of the various research “steps” (e.g., opening a page in a book, launching a search) one took while navigating the AOR corpora. This ability to view and export one’s steps or pathways through the viewer is one of the major new additions to the AOR viewer.
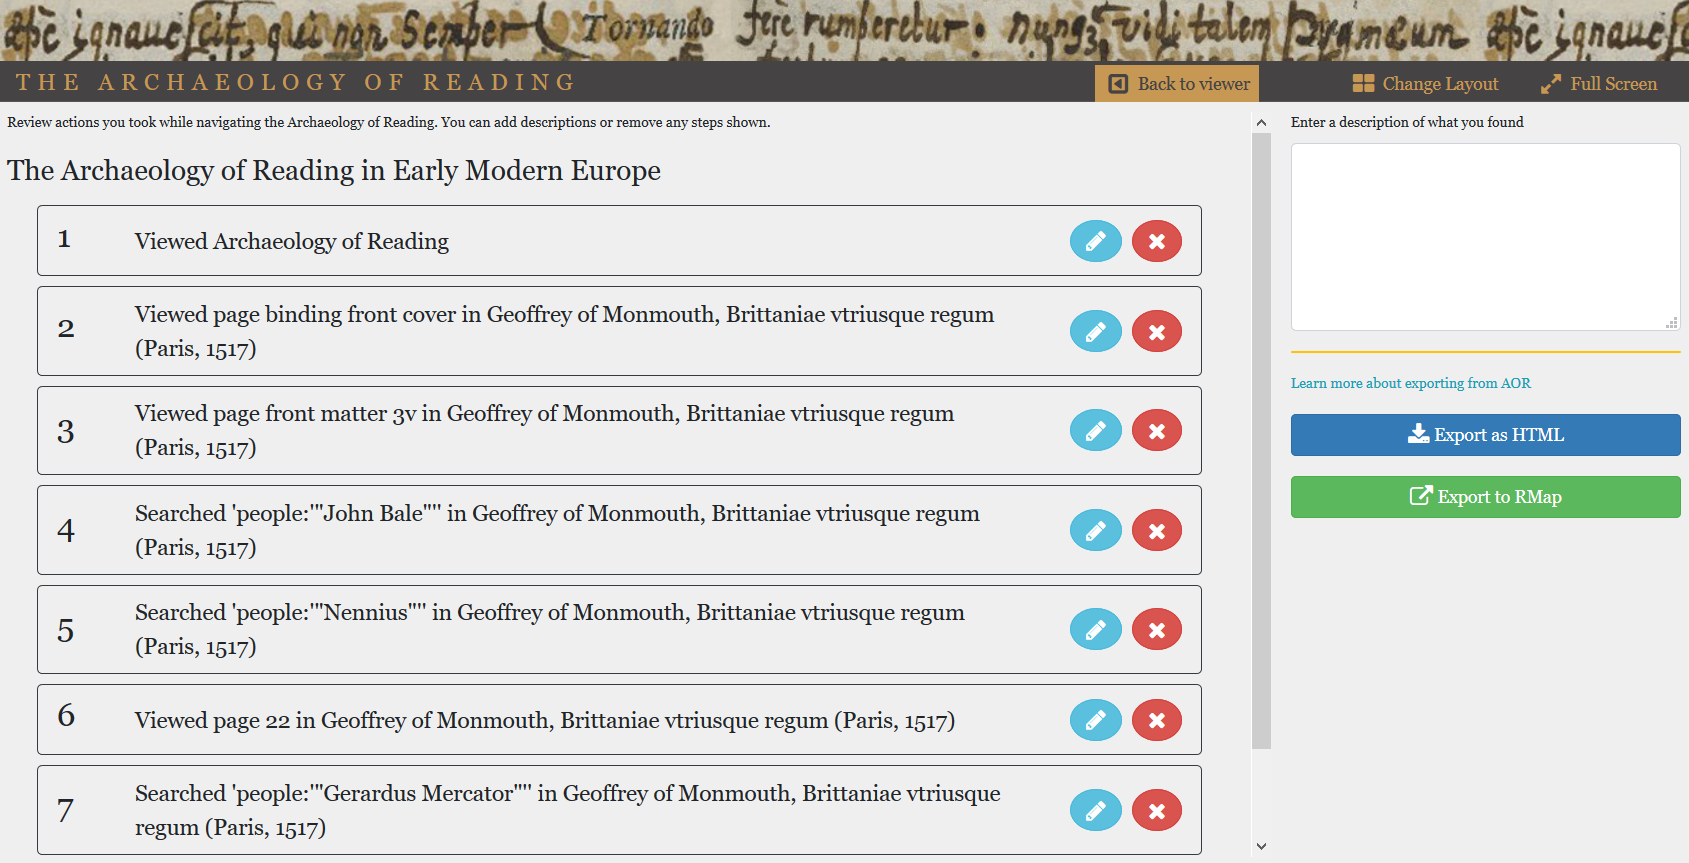
This overview is a chronological list of the steps taken or activities undertaken by the user in the viewer, a powerful method to record the journey from point A to point B while doing research in the AOR environment. The list is dynamic: steps can be deleted (by clicking the red X button) and information can be added (by clicking the blue pencil button) to each of the steps. To add more steps after editing or annotating the list, click the “Back to Viewer” button on the right of the masthead.
The list can be exported in two ways, namely as a simple HTML file and as a linked data graph, generated by RMap.
HTML Export
By clicking on the button “Export as HTML” one has the ability to preview the export and to change the file name:
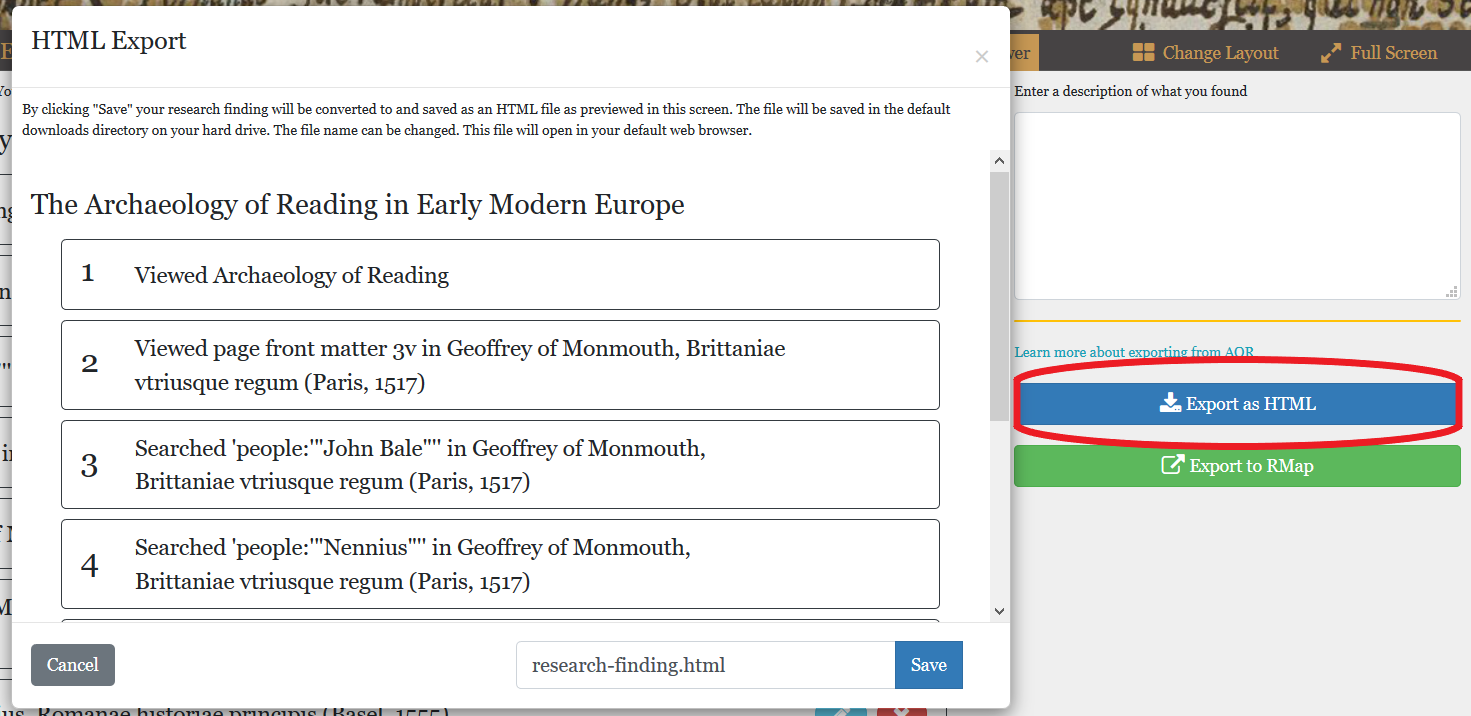 After having clicked on the save button, the file will be downloaded onto the downloads directory on your computer’s hard drive. This resulting document will be a simple HTML document containing a list with all the research steps. Each of this steps is a clickable link which will take one to that particular “state” of the viewer that has been saved (e.g., a particular image, search result, etc).

This export function provides an intuitive way to capture one’s pathways through the viewer and makes it possible to quickly store one’s research and continue with it at some point in the future. It should be noted that when returning to the viewer by clicking on a link in the exported file, the research history is wiped clean and starts anew (e.g., by clicking on the link below number 6, the viewer navigates to that particular image but has not also cached steps 1-5 and 7-8). However, one can continue one’s research by simple clicking on the last link of the exported file. Since the content in this HTML file can easily be copied into another document, it is possible to connect the research steps saved to various HTML files by copying everything, for instance, to a Word document.
RMap Export
1. Introduction and registration
RMap or Resource Map is a tool to generate linked data graphs called Distributed Scholarly Compound Object or DiSCO. These linked data graphs are basically maps comprising the various related components of scholarly works (e.g., articles), including data sets, authors, publishers, (online) resources, referred works, and so on. Many of these components are stored in separate repositories and often have been assigned different identifiers. RMap seeks “to provide a service that allows you to capture and preserve the maps of relationships found amongst these distributed works that is independent of the works themselves.” A powerful aspect of this tool is that links between objects are maintained across multiple resource maps. That is to say, a resource map or DiSCO does not exist on its own, but is linked to other DiSCOs with which it has something in common (e.g. sharing a contributing author or having used the same online repository). Taken together, the resource maps describe the underlying relationships between the components of not one but many scholarly objects.
AOR has incorporated the RMap technology in pursuit of different ends, namely to make it possible to export and retrieve research findings that originated in the AOR digital research environment. By mapping the RMap data model onto the AOR data model, it has proven to be possible to export the AOR research findings as resource maps or DiSCOs. Before moving on to the uses of RMap in relation to AOR, let’s first see how to register as a user of RMap and how to obtain the so-called API key necessary for the creation of your own resource map.
RMap and API keys
In order to register, one can go to directly the RMap site or, alternatively, go there via the AOR viewer. In the viewer, click on the button “Export current research,” just as was shown with the HTML file. When clicking on the green “Export to RMap” button, a new window opens in which one is asked to provide a RMap API Key.
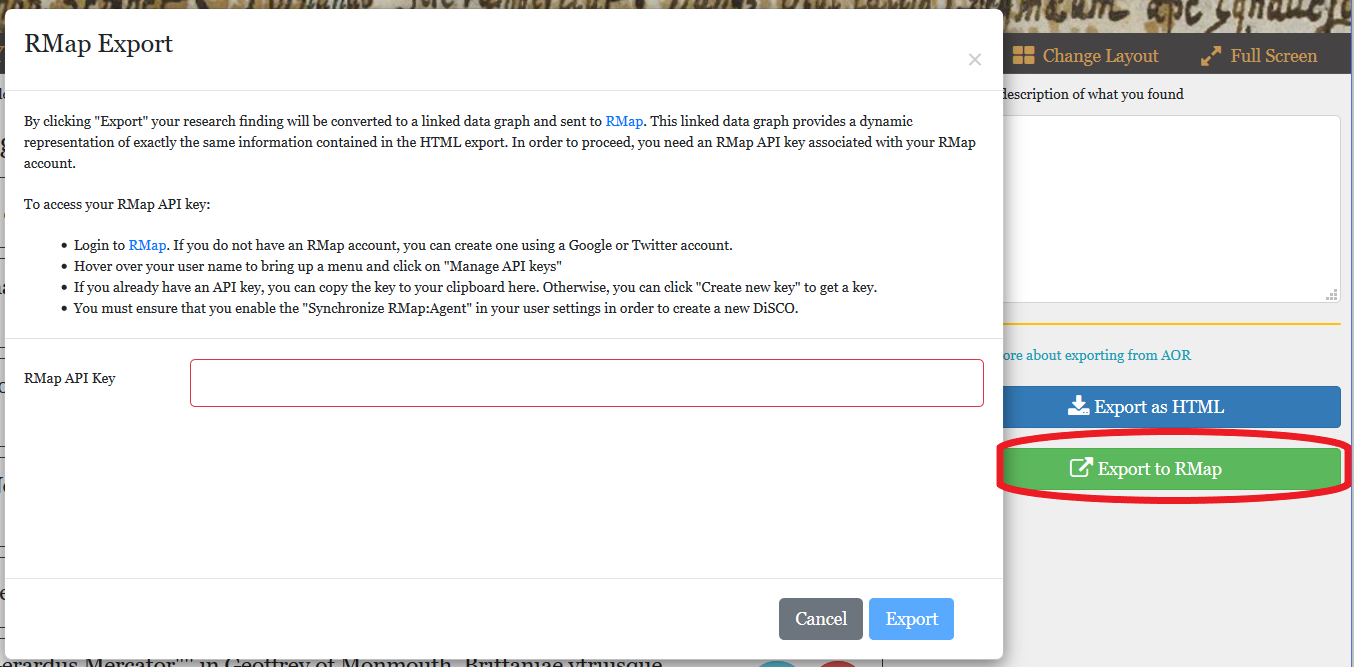
In order to acquire such a key, please login to RMap. You can do so by clicking the link in the export window.
After having registered, sign in and go to “manage API keys.”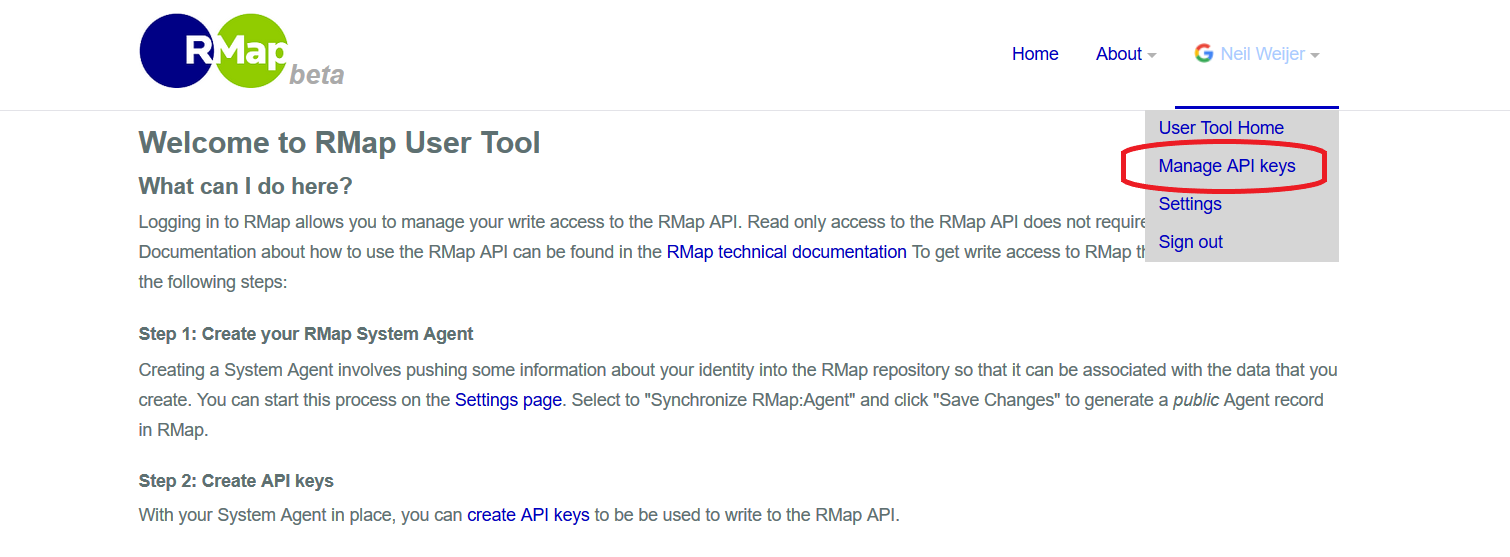
Now one can create a new API key or manage existing ones. Create a key and by clicking on “create new key” press “copy key to clipboard.”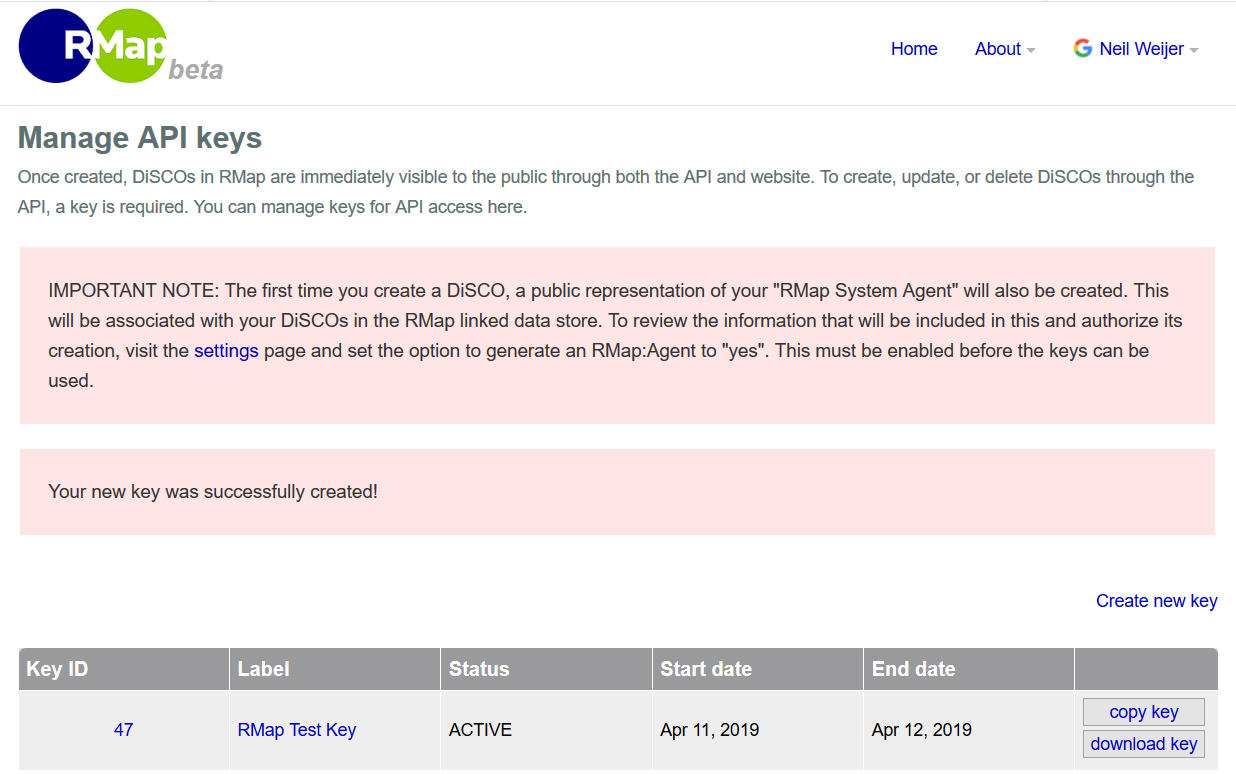
Now this key can be copied into the designed field in the open window in the AOR viewer. After that, click the “Export” button in the lower right corner of the window.
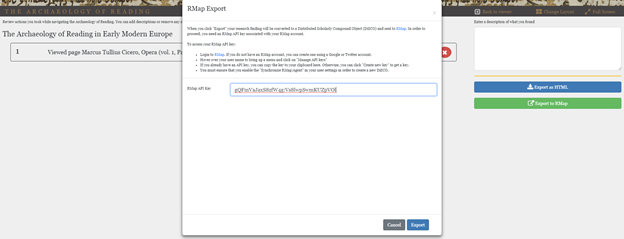
When the export is successful, a link is created and appears in the bottom of the window:

Clicking on this link will open the linked data graph. Note that some difficulties to submit research findings to RMap have been reported in the past. While these problems should be solved, emptying the cache of your browser could help solving this issue if it continues to occur.
2. Uses of RMap
The uses of RMap in connection with the AOR viewer are threefold:
1) To export and share research findings
2) To conduct research
3) To use as a pedagogical tool
2.1 Exporting and sharing research findings
Users have the possibility to export their research findings from the AOR digital research environment as a simple HTML file and as a linked data graph generated by RMap. As such, the HTML file and the linked data graph are different visualizations of a similar research finding. Whereas the former has the advantage of simplicity, the linked data graphs generated by RMap, although more complex and hence more difficult to read, have distinct advantages:
1) Whereas HTML files only exist on a user’s hard drive (that is, until the moment the user decides to upload it and make it publicly available, RMap DiSCOs have persistent URIs, are publicly available, and can be linked to one’s ORCID (a persistent identifier for individual researchers), thus making it possible to share research.
2) RMap DiSCOs create persistent links between the various parts of one particular research finding but also maintain links between shared aspects of different research findings (i.e. links are established not only within individual DiSCOs, but also across them).
3) By virtue of being publicly available and having links across DiSCOs, these linked data graphs are powerful tools for doing original research.
Before delving into the more advanced uses of RMap linked data graphs, let us first enhance our understanding of RMap by comparing DiSCOs with the HTML exports. Consider the following research scenario.
I’m interested in marginal notes in the AOR Dee corpus which mention the Italian medical doctor and astrologer Girolamo Cardano. I took the following steps:
1) Opened the AOR viewer
2) Opened the advanced search in the book gallery, select people, and search for “Giralomo Cardano” (in between double quotation marks to only search for a perfect match).
3) Selected the first search result, which took me to Domenichi, Facetie, p. 10.
4) Opened the search panel and launched another search for “Giralomo Cardano”, but now only in this book.
5) Opened a search result and navigated to page 387 of this book.
6) Looked at the transcription panel and made use of an internal link to search for “Johannes Jacob Wecker” across the AOR corpora.
7) Opened the first search result and navigated to the title page of Frontinus’ Strategemes.
When clicking on the “Export current research” button in the upper taskbar, the following overview appears, detailing the various activities I undertook:
The exported HTML file of this research finding replicates the simple structure of this list (click here to view the file):
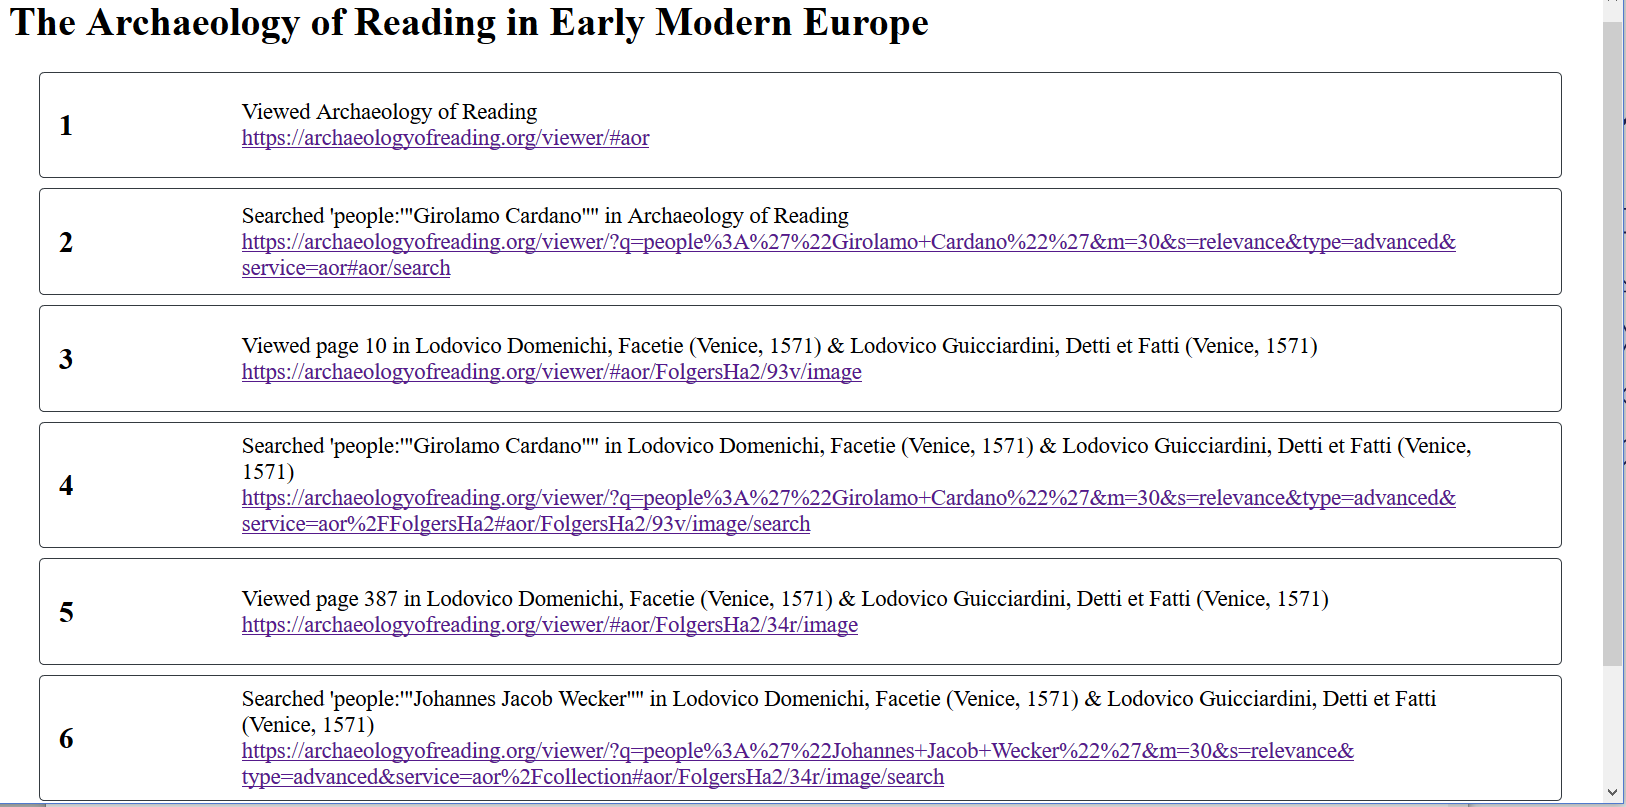 All the individual items are clickable links, enabling the user to view each item in the viewer. What actually happens in that the link captures a particular state of the viewer (viewed item, launched, search, etc.) and by clicking one a link one ‘restores’ that state of the viewer. In this way it is possible to export and revisit one’s research findings.
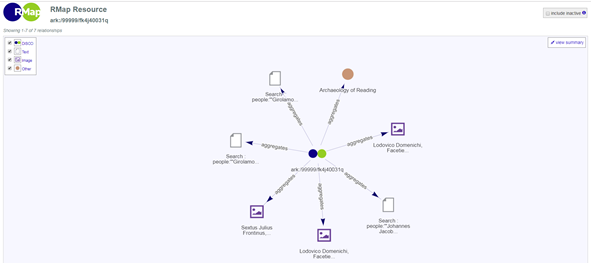
Compare this to the RMap DiSCO of the same research finding (click here to view it in your browser).
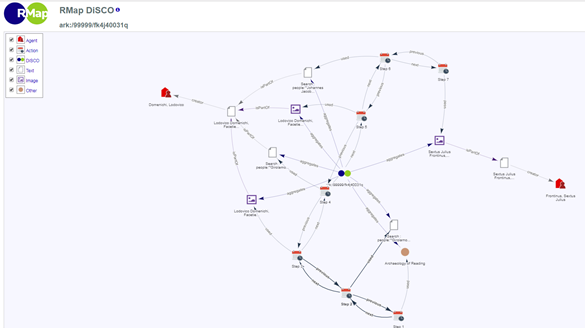
Everyone will agree that this graph looks infinitely more complex than the simple list of the HTML file. However, this is a linked data representation of the similar research finding. Let’s dissect this graph in order to understand what is happening.
A DiSCO consists of nodes and edges. In this case, nodes can represent various entities, such as actions, agents, text, and images. The edges represent various actions that have been undertaken and establish the link between a subject and object (taken together, these are the three components of an RDF triple). The first two research steps are visualized as a node of the type ‘action’ (see the key to the graph in the upper-left corner). The first step consisted of viewing the book gallery, hence Step 1 (the subject) used (predicate) the Archaeology of Reading (object). In a similar fashion, Step 2 used the search function, in this particular case a search for “Girolamo Cardano” across the AOR corpora.
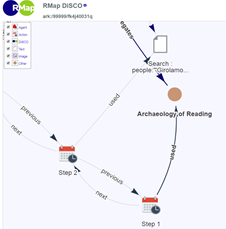
Just as the items in the exported HTML file are clickable links, so are several nodes in this graph. For example, by clicking on the “Search: people “Girolamo…” text node, this window opens (see image below). By clicking on the URI in the window, the user is taken directly to the search result in the viewer – the links contained in the linked data graph function are exactly similar to those in the HTML file!

Let us continue and isolate another part of the graph:

This part of the graph is particularly dense, mainly due to the various edges that show that the DiSCO (displayed as the two colored dots in the middle) has aggregated the information derived from a number of objects in the graph. These edges can be ignored. Note, too, that DiSCOs are dynamic and that their layout can be changed simply by dragging a node across the screen.
What we see here is that the user moved on to research step 4, another search, again for “Girolamo Cardano” but this time within Domenichi’s Facetie (as opposed to the earlier search across the corpus)—hence the edge (labelled ‘isPartOf’) between the search and the other textual node which represents this book (the Facetie). Step 5 comprises the navigation in the viewer to another image in the Facetie. Again, seen from this perspective, a linked data graph is nothing but a dynamic visualization of one’s research findings, as opposed to a static HTML file.
Well, you might say, if this is the case, why not simply stick to a simple HTML file? One advantage, as mentioned above, is the public nature of DiSCOs. As they have a persistent URL, they can be shared easily. Moreover, on the homepage of RMap, one can search all the available DiSCOs. Hence it is possible to find the research findings of experts in the field, such as the one made by our PI, Earle Havens, available here. The ability to link DiSCOs to one’s research profile or persistent identifier, such as ORCID, only increases the visibility of such research findings in the public domain. Note that it is not obligatory to share DiSCOs publicly. To avoid doing so, simply go to the settings menu and set “Synchronize RMap:Agent” to ‘no’. Lastly, since DiSCOs themselves have a permanent and stable identifier and, when used in the context of AOR, contain stable links to content in the AOR viewer, all this information can easily be included in (traditional) scholarly output.
2.2 Conducting research through DiSCOs
Another, perhaps even more powerful advantage of linked data graphs, is the possibility of using DiSCOs as resources for one’s research. As mentioned, DiSCOs do not exist in a vacuum, but are linked to other DiSCOs with which they share one or more aspects in common. Consider the following research scenario.
A scholar is interested in the reception of Ptolemy in the early modern period and decides to search for “Ptolemy” in Maternus’ Astronomicon. The research steps are as follows:
1) Open the AOR viewer
2) Open Maternus’s Astronomicon
3) Open the advanced search and search for “Ptolemy” in the marginalia
4) Open page 94 of Maternus’s Astronomicon
5) Search for “Girolamo Cardano” in the Astronomicon (by clicking on his name in the transcription panel)
6) Open page 109 of the Astronomicon
7) Search for “Girolamo Cardano” across the AOR corpora (by clicking on his name in the transcription panel)
8) Open the title page of Frontinus’ Strategemes.
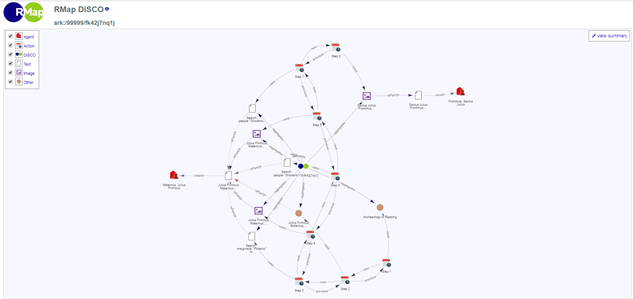
The resulting DiSCO can be accessed here.
DiSCOs, since they are dynamic linked data graphs, can be manipulated by dragging a node across the screen, something which is likely to affect that layout of the entire diagram. DiSCOs can also be reorganized by selecting a node and by clicking the button “Redraw with this node at the center”. For example, first an image of the ‘orginal’ DiSCO followed by an image of the DiSCO which centres on an image from Frontinus’ Strategemes.
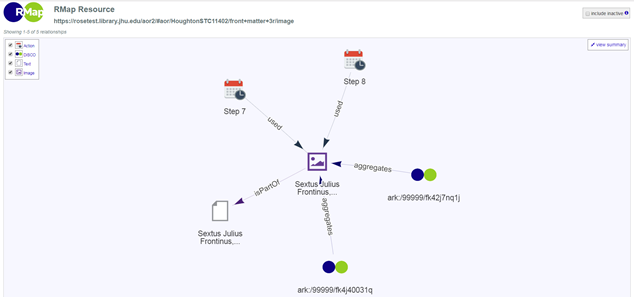
As you can see, this image is linked not to one but two DiSCOs because this image appears as a node in another linked data graph as well. In order to ‘walk the graph’ and move over to the other DiSCO (ending in 0031q), simply select it and click the button “Redraw with this node at the center”. This opens the DiSCO based on the first research scenario described above, but in a slightly different view: one sees the DiSCO at the centr and all the objects associated with it grouped around it.
In order to navigate to the entire DiSCO—that is, the graph showing all the actions such as the research steps—click on the link under the header “Related DiSCOs” in the upper-right corner.
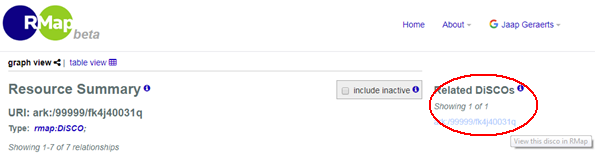
Notice, as well, that in the previous image “Archaeology of Reading” also appears as an object. By centering on this node, one can see all the DiSCOs that are associated with this object (which technically represents the book gallery of AOR, the start of every activity undertaken in the AOR digital research environment).
Only two DiSCOs are shown, as so far only two DiSCOs that point to this particular instance of AOR on a test server are created, but in the future more DiSCOs will be releated to AOR once the updated viewer has gone live.
By walking the graph in this manner, we can discern how other scholars arrived at a particular object, including search results, books, or images. Seeing the connections made by other scholars is likely to inspire and stimulate one’s own thinking about historical reading practices. In other words, just as the AOR digital research environment enables us to follow the pathways early modern readers took through their books, so RMap provides us with the possibility of capturing and revisiting our own pathways as well as those of other researchers.
2.3 Pedagogical uses of RMap
From what has already been said it is not difficult to imagine the pedagogical applications of RMap. DiSCOs can be used in a classroom to explain to students how to construct particular queries, how to navigate a resource such as AOR, which is populated with detailed data, and how to make use of DH projects in general. Moreover, due to the fact that DiSCOs are available online and can be saved, the pathways taken by leading experts through annotated early modern imprints can provide stimulating examples of how masters of the trade handle and traverse this material. For more information, see the section of this website on the pedagogical aspects of AOR.